Your AI agent just approved a $50,000 invoice for office supplies. A legitimate vendor. The PO number matches. But the quantity is wrong by a factor of 10. By the time finance catches it, you’ve already paid, the goods already shipped, and you’re stuck negotiating a return.
The agent’s logs show “decision: approved” but nothing about why it ignored the quantity anomaly that a human would have caught instantly. Without proper instrumentation, root cause analysis stretches from minutes to days. This is what happens when observability is treated as “nice to have” instead of foundational infrastructure.
This post covers the production architecture, the vendor-neutral stack, and why you need to instrument before deployment, not after the first failure.
Table of contents
Contents
- Why Should Observability Be Foundational Infrastructure?
- What Is Decision Provenance and Why Does Compliance Require It?
- How Do Silent Integration Failures Kill AI Agents?
- Why Do Token Costs Spiral Out of Control?
- What Does a Vendor-Neutral Observability Stack Look Like?
- What Is the ROI and How Do You Start?
- Are You Ready for Production?
- References
Why Should Observability Be Foundational Infrastructure?
When your agent fails in production, you need to answer three questions immediately: What decision did it make? What data did it use? How much did it cost? Without observability built in from day one, you’re flying blind. The difference between a 5-minute fix and a 5-hour war room is whether you instrumented decision provenance, integration health, and cost tracking before deployment.
The Observer Effect Paradox
Instrumentation changes what you measure. Synchronous logging to external systems adds latency to every LLM call. In multi-agent systems, this can trigger timeout-based retries where observability causes the failures it detects.
OpenTelemetry’s BatchSpanProcessor solves this by queuing spans in memory and exporting in batches, minimizing per-request overhead.
What Is Decision Provenance and Why Does Compliance Require It?
How do you prove your AI agent made the right decision six months ago when a regulator asks? Logging outputs without reasoning fails every major compliance framework.
Why Every Framework Requires Decision Trails
Every major compliance framework mandates reconstructible reasoning.
- SOC 2 Type II: audit trails of system access and user activity. The
gen_ai.conversation.idattribute ties every decision to a user and timestamp. - GDPR Article 30: records of processing activities. Structured logs with trace IDs link inputs to outputs.
- HIPAA: audit controls for ePHI access. Span attributes capture what data the agent accessed.
- PCI DSS 4.0.1 Requirement 10: tracking cardholder data access with automated log reviews. Prometheus metrics enable real-time anomaly detection.
Structured Logging with Correlation IDs
The fix links every decision to its inputs.
from opentelemetry import trace
from opentelemetry.trace import Status, StatusCode
import logging

tracer = trace.get_tracer(__name__)
logger = logging.getLogger(__name__)

def make_decision(invoice_data, retrieved_context):
    with tracer.start_as_current_span("make_decision") as span:
        span.set_attribute("invoice.id", invoice_data["id"])
        span.set_attribute("invoice.amount", invoice_data["amount"])
        span.set_attribute("context.sources", len(retrieved_context))

        decision = analyze(invoice_data, retrieved_context)
        confidence = calculate_confidence(decision)

        span.set_attribute("decision.result", decision["action"])
        span.set_attribute("decision.confidence", confidence)

        logger.info(
            "Decision made",
            extra={
                "trace_id": format(span.get_span_context().trace_id, "032x"),
                "invoice_id": invoice_data["id"],
                "decision": decision["action"],
                "confidence": confidence,
                "context_count": len(retrieved_context)
            }
        )

        return decisionagent/decision_logger.py
Code Snippet 1: OpenTelemetry structured logging captures decision provenance with trace IDs, span attributes, and correlation across the entire request lifecycle.
This gives you a complete audit trail: trace ID links the decision to all upstream data retrievals, span attributes capture the decision logic, and structured logs provide queryable records. When the regulator asks “why did you approve invoice #12345?”, you can show exactly what data the agent saw and how it weighted each factor.
Tracking Tool Calls with GenAI Semantic Conventions
Multi-agent systems make dozens of tool calls per decision. OpenTelemetry’s GenAI semantic conventions provide standard attributes for tracking these interactions:
from opentelemetry import trace

tracer = trace.get_tracer(__name__)

def execute_tool_call(tool_name, arguments, conversation_id):
    with tracer.start_as_current_span("execute_tool") as span:
        # Standard GenAI attributes
        span.set_attribute("gen_ai.operation.name", "execute_tool")
        span.set_attribute("gen_ai.tool.name", tool_name)
        span.set_attribute("gen_ai.conversation.id", conversation_id)
        span.set_attribute("gen_ai.tool.call.arguments", str(arguments))

        result = call_tool(tool_name, arguments)

        span.set_attribute("gen_ai.tool.call.result", str(result))

        return resultagent/tool_tracking.py
Code Snippet 2: GenAI semantic conventions enable cross-platform analysis across LangChain, LlamaIndex, and custom agents.
Standard attributes like gen_ai.tool.name let you answer operational questions across your entire stack: “Which tools fail most often?” or “Which conversations require the most tool calls?” When you swap frameworks, your dashboards still work.
How Do Silent Integration Failures Kill AI Agents?
Your AI agent calls a legacy API that returns HTTP 200 with an empty result set. The agent interprets “no data” as “no problem” and proceeds. But the API actually failed silently because the database connection pool was exhausted. By the time you notice, you’ve processed 500 transactions with incomplete data.
AI agents don’t fail loudly. They fail gracefully, hiding problems until they cascade. You need distributed tracing that correlates agent decisions with integration health across every dependency.
from opentelemetry import trace, propagate
from opentelemetry.trace import Status, StatusCode

tracer = trace.get_tracer(__name__)

def retrieve_from_legacy_api(query):
    with tracer.start_as_current_span("legacy_api_call") as span:
        span.set_attribute("api.endpoint", "/legacy/search")
        span.set_attribute("query", query)

        headers = {}
        propagate.inject(headers)  # Inject trace context

        response = requests.get(
            "https://legacy.example.com/search",
            params={"q": query},
            headers=headers
        )

        span.set_attribute("http.status_code", response.status_code)
        span.set_attribute("response.size", len(response.content))

        if response.status_code == 200 and len(response.json()) == 0:
            span.set_status(Status(StatusCode.ERROR, "Empty result set"))
            span.add_event("Suspicious empty response from healthy endpoint")

        return response.json()agent/trace_integration.py
Code Snippet 3: Distributed tracing propagates correlation IDs and flags suspicious patterns like empty responses from healthy endpoints.
Correlation ID propagation (line 12) and explicit error marking for suspicious patterns (lines 23-25) are what matter. When you see a spike in “empty result set” errors correlated with database saturation metrics, you know the integration is degraded even though HTTP status codes look fine.
Why Do Token Costs Spiral Out of Control?
Your agent works in testing. Then production traffic hits and your LLM bill explodes. AI costs are surging 36% year-over-year, yet only half of organizations can confidently evaluate ROI (CloudZero, 2025). Without per-operation cost tracking, you can’t identify which workflows are burning money.
Consider a Claude 4.5 Sonnet deployment: input tokens cost $3/million, output tokens cost $15/million. A single complex query might use 50K input tokens and 4K output tokens, costing $0.21. At 10,000 queries per day, that’s $2,100 daily, or $63,000 monthly, just for one workflow. If your agent retries on failures or chains multiple calls, costs multiply fast.
from prometheus_client import Counter, Histogram

# Token counter with model and operation labels
tokens_total = Counter(
    'ai_tokens_total',
    'Total tokens consumed',
    ['model', 'operation', 'user_tier']
)

# Latency histogram with cost correlation
request_duration = Histogram(
    'ai_request_duration_seconds',
    'Request duration',
    ['operation'],
    buckets=[0.1, 0.5, 1.0, 2.0, 5.0, 10.0, float('inf')]
)

def process_query(query, user_tier):
    with request_duration.labels(operation='query').time():
        embedding = embed(query)
        tokens_total.labels(
            model='text-embedding-3-small',
            operation='embed',
            user_tier=user_tier
        ).inc(len(query.split()))

        results = vector_search(embedding)

        response = generate_response(results)
        tokens_total.labels(
            model='claude-4.5-sonnet',
            operation='generate',
            user_tier=user_tier
        ).inc(response['usage']['total_tokens'])

        return responseagent/metrics.py
Code Snippet 4: Prometheus metrics track token usage with labels for model, operation, and user tier, enabling real-time cost monitoring and per-operation granularity to prevent budget overruns.
Alerting on Token Budgets
Labels let you slice cost by model, operation, and user tier. When free-tier token usage spikes on expensive models, you can throttle, switch to cheaper models, or convert users to paid tiers before costs spiral.
groups:
- name: ai-cost-alerts
  rules:
  - alert: TokenBudgetExceeded
    expr: sum(rate(ai_tokens_total[5m])) by (user_tier) > 1000
    for: 5m
    labels:
      severity: warning
    annotations:
      summary: "Token budget exceeded for {{ $labels.user_tier }}"
      description: "{{ $labels.user_tier }} tier consuming {{ $value }} tokens/sec"ai-alerts.yml
Code Snippet 5: Prometheus alerting rule triggers when any user tier exceeds 1,000 tokens per second sustained over 5 minutes, enabling proactive cost control before budget overruns.
What Does a Vendor-Neutral Observability Stack Look Like?
Enterprise platforms like Datadog and Splunk offer polished, integrated experiences. For teams prioritizing cloud-native portability, OpenTelemetry handles instrumentation, Prometheus stores metrics, and Grafana visualizes everything. Zero licensing cost, no vendor lock-in, and production-proven.
Already invested in an enterprise platform? OpenTelemetry collectors export directly to these platforms, preserving full trace context and semantic attributes. You can adopt incrementally without disrupting existing dashboards, gaining richer observability now and portability for future migrations.
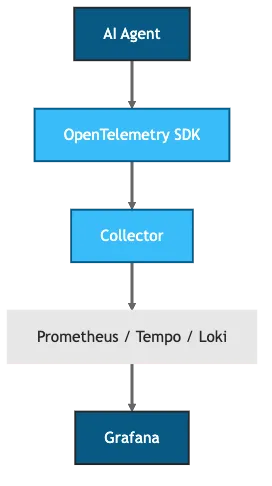
Figure 1: OpenTelemetry + Prometheus + Grafana stack
How the Components Connect
Your agent emits traces, metrics, and logs via OpenTelemetry SDKs. The OpenTelemetry Collector receives, processes, and routes telemetry to backends. Prometheus scrapes metrics and stores time-series data. Grafana queries Prometheus for metrics, Tempo for traces, and Loki for logs, correlating them in unified dashboards.
Why Trace-Metric Correlation Matters
When a user reports “the agent is slow”, start in Grafana, filter metrics by user ID, see elevated p95 latency, drill down to the request, and find the bottleneck in 30 seconds. Without correlation, you’re grepping logs for hours.
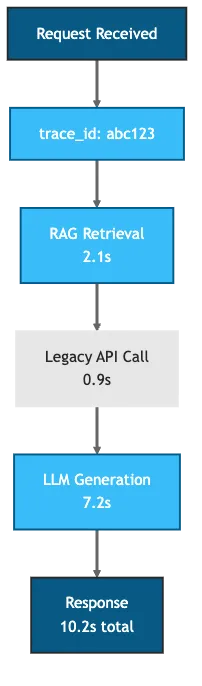
Figure 2: Trace ID propagation with per-operation latency breakdown
Every request gets a correlation ID that propagates through RAG retrieval, API calls, and decision logic. When you need to audit a decision, query by trace ID to reconstruct the entire flow: what data was retrieved, which APIs were called, response times, and token consumption.
What Is the ROI and How Do You Start?
Setup cost for the vendor-neutral stack is roughly 40-80 hours of engineering time ($8K-$16K at $200/hour), with payback in 1-3 months. Chronosphere’s Forrester TEI study shows 165% ROI with 6-month payback for observability investments (Forrester, 2022). Microsoft Sentinel’s TEI study shows 201% ROI for security observability (Forrester, 2020). This stack delivers comparable ROI with full portability.
| Without | With |
|---|---|
| $5K-$20K/month untracked token spend | Per-request cost attribution |
| 4-8 hours debugging per incident | 30 minutes with trace correlation |
| $20K-$50K manual audit reconstruction | Query-ready decision logs |
Table 1: AI Observability ROI
Start small: instrument one critical path (the highest-risk decision your agent makes) with decision provenance logging. Add integration health tracing for your most fragile API dependency. Implement cost tracking for your most expensive model. Expand based on what breaks. This is the same incremental approach I described in my AI agents ROI post: start with 5% of workflows, prove value, then scale.
Already using RAG for legacy systems? Add distributed tracing to correlate retrieval failures with agent decisions. Implementing AI-augmented CI/CD? Instrument the feedback loop to measure latency reduction. Building multi-agent orchestration? Add trace IDs to handoff files to debug cross-agent failures. Even without a full tracing backend, a shared ID lets you grep the entire workflow chain.
Decision provenance, integration health, and cost runaway are not edge cases. They cause production AI failures. Fix them before deployment, not after the invoice arrives.
Are You Ready for Production?
Before your next AI deployment, verify these four capabilities:
- Decision provenance: High-risk workflows log inputs, reasoning, and outputs with trace IDs using OpenTelemetry and structured logging
- Integration health: Distributed tracing covers legacy APIs and third-party services, with alerts on silent failures like empty responses from healthy endpoints
- Cost attribution: Token usage tracked per model, operation, and user tier, with budget alerts via Prometheus metrics
- Audit reconstruction: Any decision from the past 12 months can be fully reconstructed in under 30 minutes
If you can’t check all four, you’re not ready for production.
For the SRE framework that operationalizes decision provenance with error budgets and trust ladders, see SRE for AI Agents: Error Budgets, Trust, and 90 Trials.
References
- AICPA, “2017 Trust Services Criteria (With Revised Points of Focus - 2022)” (2022) - https://www.aicpa-cima.com/resources/download/2017-trust-services-criteria-with-revised-points-of-focus-2022
- CloudZero, “The State of AI Costs in 2025” (2025) - https://www.cloudzero.com/state-of-ai-costs/
- European Union, “GDPR Article 30: Records of Processing Activities” (2018) - https://gdpr-info.eu/art-30-gdpr/
- Forrester Consulting, “The Total Economic Impact of Chronosphere” (2022) - https://chronosphere.io/forrester-total-economic-impact-chronosphere/
- Forrester Consulting, “The Total Economic Impact of Microsoft Sentinel” (2020) - https://tei.forrester.com/go/microsoft/microsoft_sentinel/
- Kiteworks, “HIPAA Audit Logs: Complete Requirements for Healthcare Compliance in 2025” (2025) - https://www.kiteworks.com/hipaa-compliance/hipaa-audit-log-requirements/
- OpenTelemetry, “Semantic Conventions for Generative AI Systems” — https://opentelemetry.io/docs/specs/semconv/gen-ai/
- OpenTelemetry, “Tracing SDK Specification” — https://opentelemetry.io/docs/specs/otel/trace/sdk/
- PCI Security Standards Council, “PCI DSS v4.0.1” (2024) - https://docs-prv.pcisecuritystandards.org/PCI%20DSS/Standard/PCI-DSS-v4_0_1.pdf